Debugging Tools
Overview
Flash's debugging support extends only as far as JavaScript error messages (which are sometimes completely misleading) so xJSFL provides a range of functionality to let you debug erroneous code including:
- Visually debugging the error stack including files, line numbers and code
- Inspection of objects in both hierarchical and tabular form
- Testing functions using xjsfl.debug.test()
- Testing external files using xjsfl.file.debug & xjsfl.file.load() rather than fl.runScript()
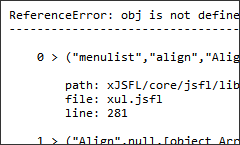
The following is the output from xjsfl.debug.func() trapping an erroneous obj reference 3 levels down from the original function call:
ReferenceError: obj is not defined
----------------------------------------------------------------------------------------------------

    0 > ("popupslider","a","A",[object XML],[object Object],undefined,undefined)

        path: xJSFL/core/jsfl/libraries/
        file: xul.jsfl
        line: 284

    1 > ("title:Multiplier,numeric:A=[0,-100,100],numeric:B=[0,-100,100]")

        path: xJSFL/core/jsfl/libraries/
        file: xul.jsfl
        line: 113

    2 > ("title:Multiplier,numeric:A=[0,-100,100],numeric:B=[0,-100,100]",(function (a, b) {alert(a * b);}))

        path: xJSFL/core/jsfl/libraries/
        file: xul.jsfl
        line: 135

    3 >

        path: E:/05 - Commercial Projects/xJSFL/3 - development/xJSFL Projects/
        file: temp.jsfl
        line: 23
Output.inspect() is arguably the workhorse of xJSFL's Output class, allowing you to hierarchically inspect any object, with built-in checks for troublesome properties that would otherwise crash Flash, and a slew of parameters to customise the processing and recursion:
Output.inspect(dom.library.items, 'Library items', 3)
Library items: Array (depth:4, objects:39, values:120, time:0.0 seconds)
--------------------------------------------------------------------------------
array => Array
    [0] => SymbolItem
        [timeline] => Timeline
             name: "star graphic"
            [layers] => Array
                [0] => Layer
             frameCount: 1
             currentFrame: 0
             layerCount: 1
             currentLayer: 0
            [bindings] => Array
         symbolType: "movie clip"
         sourceFilePath: ""
         sourceLibraryName: undefined
         sourceAutoUpdate: undefined
         scalingGrid: false
        [scalingGridRect] => Object
             left: -2147483.648
             top: -2147483.648
             right: -2147483.648
             bottom: -2147483.648
         itemType: "movie clip"
         name: "star graphic"
         linkageExportForAS: false
         linkageExportForRS: false
         linkageImportForRS: false
         linkageExportInFirstFrame: undefined

         // additional properties truncated
Documentation
Guides
JSFL API
- Output: logging, introspection, and a variety of printing and formatting methods
- Table: outputs 2D Array/Object arrays to easily-readable ASCII tables

Hey
Love the framework! Quick question: have you ever come across the situation where a library item will incorrectly report that its linkageExportForAS is false and its linkage path is undefined? Re-saving the FLA will fix the issue and JSFL will start to get the correct values …
Thanks
Jed
Not yet. I’ll be publishing a bit list of Flash “gotchas” at some point, so perhaps I could put it in there.
Glad the framework’s working out for ya!